 The Chancy Islands
  Menu
Menu
Equal and Uniform Luck
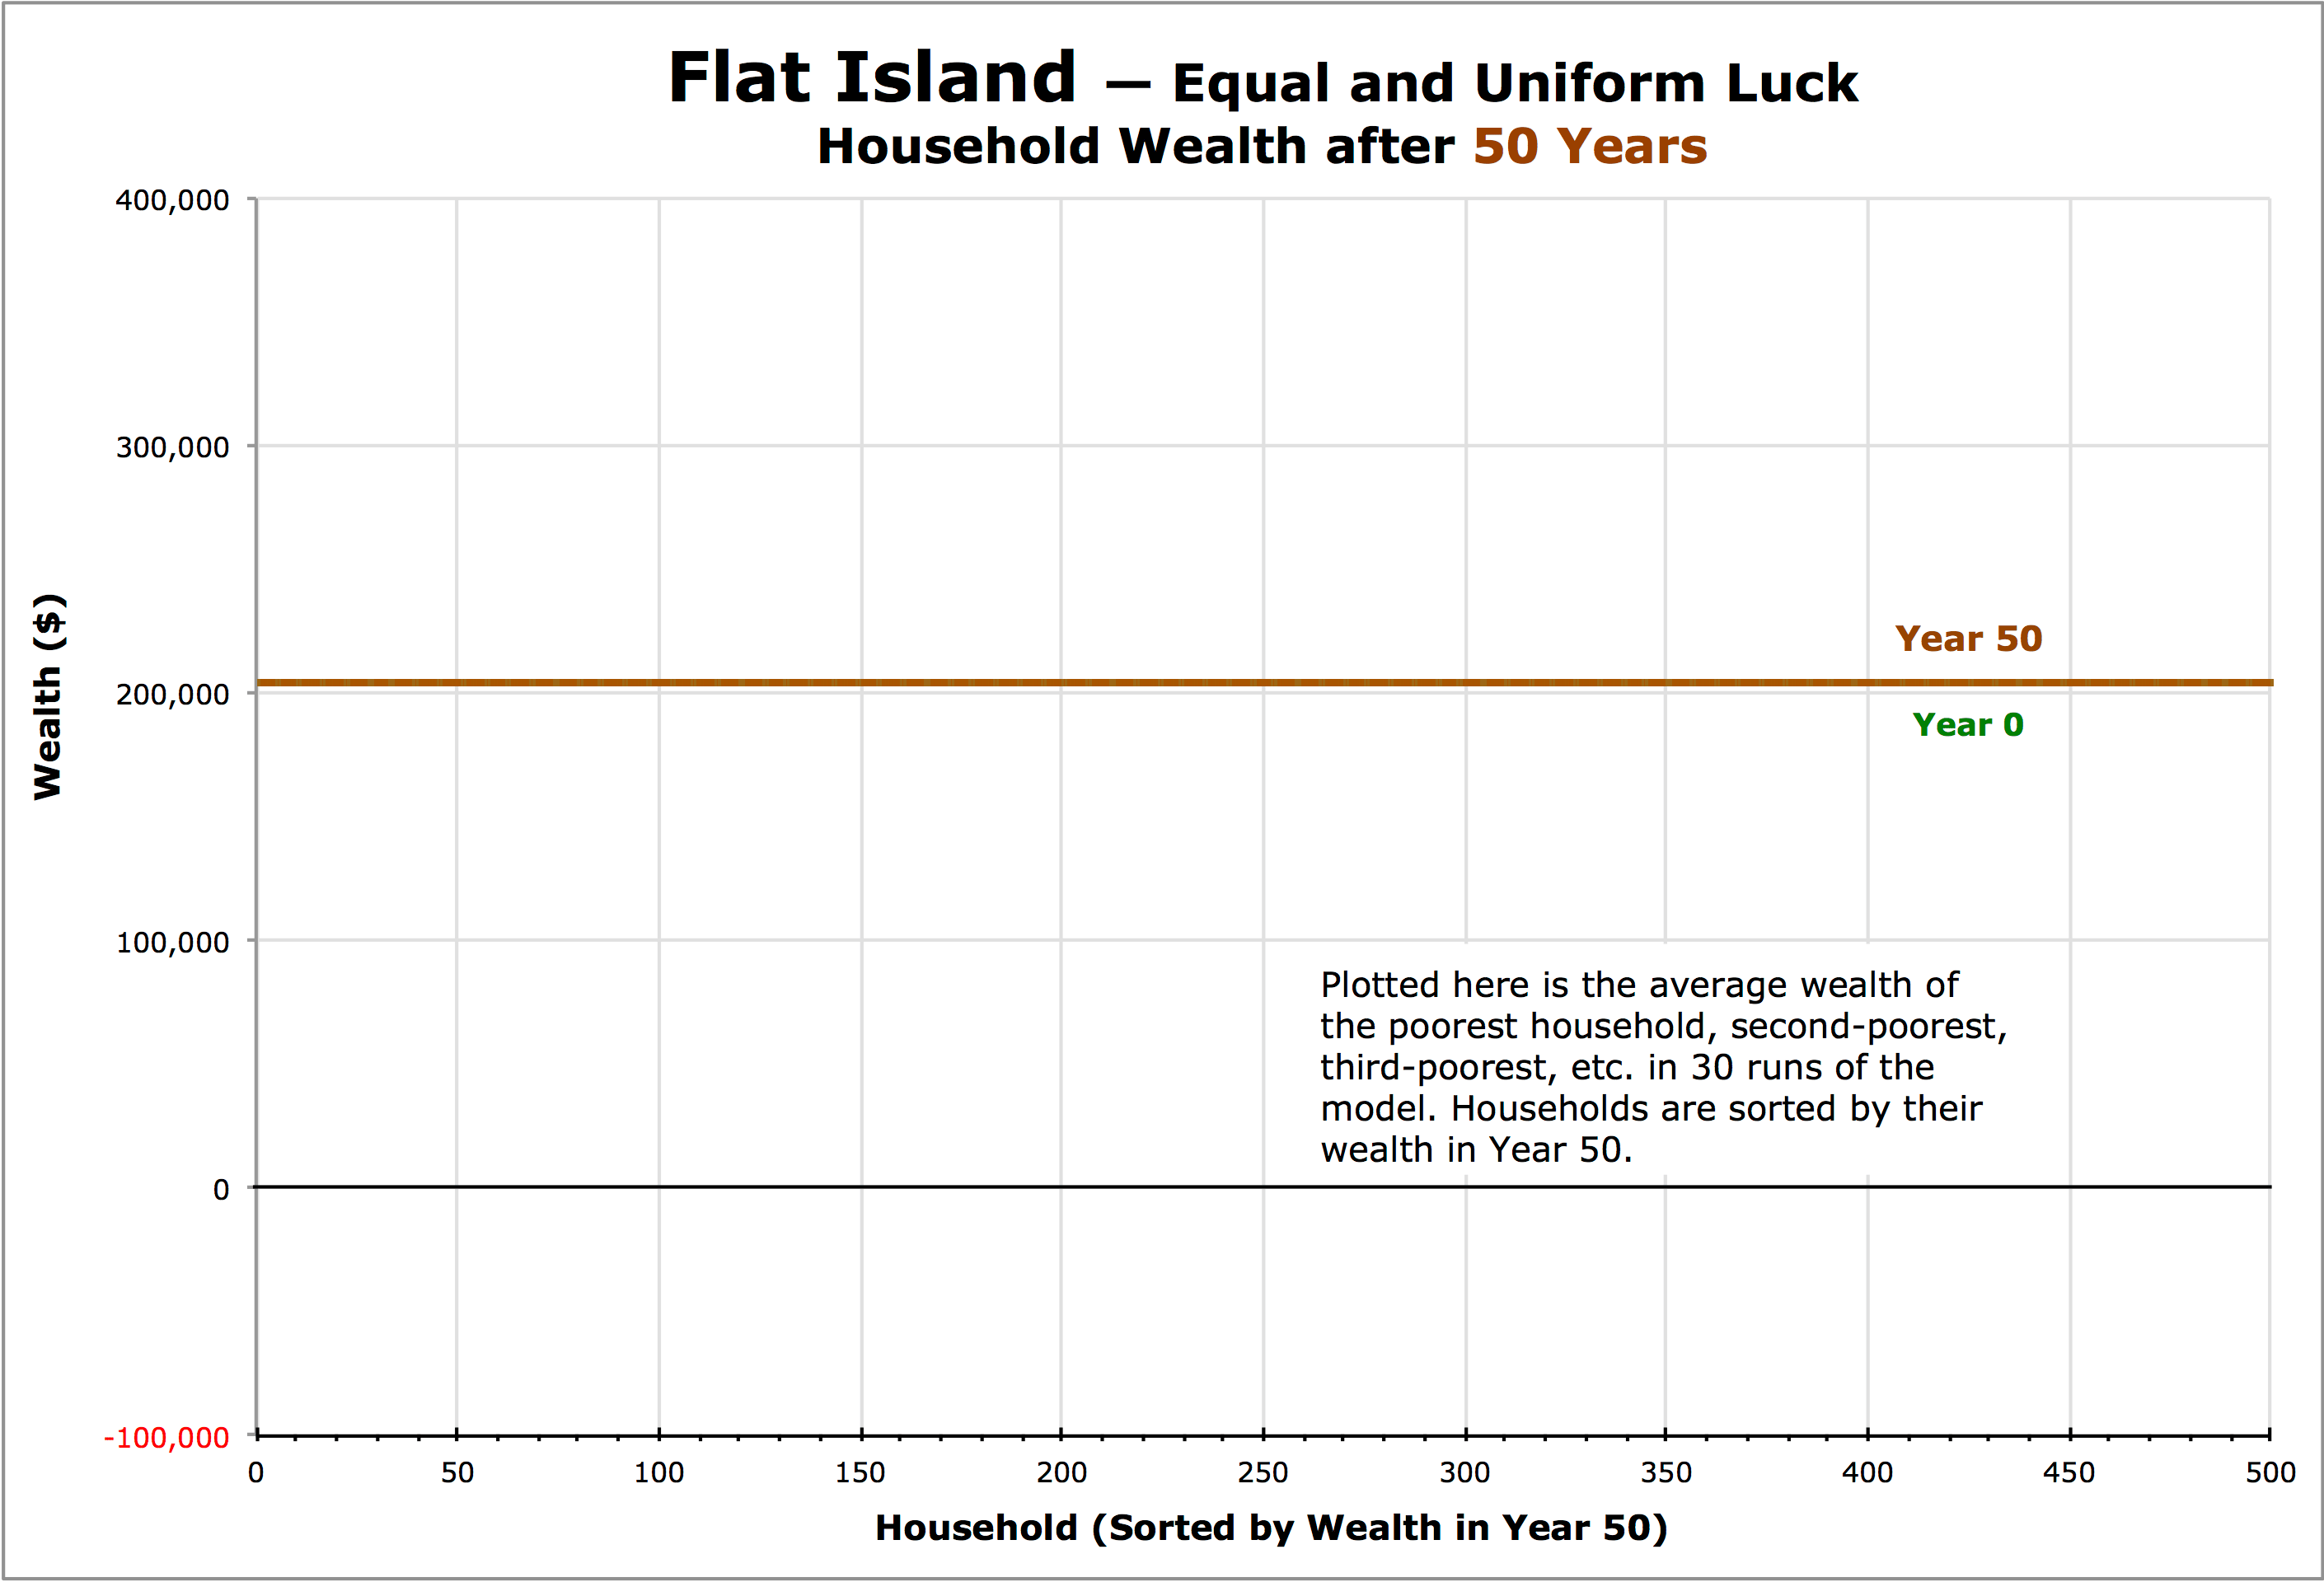
As explained on the Welcome page, Flat Island is unique among the Chancy Islands in that all 500 households have exactly the same luck. Every year, every household has the same unexpected expenses of $2,000 (not actually “unexpected” since they are always the same) and the same catastrophic loss of $4,000. Every household has the same income and expenses and the expenses exactly balance the income. So each household begins with wealth equal to $205,000 and each maintains this same wealth forever. Nothing changes and, as a result, this island is quite uninteresting.
A graph plotting the wealth for each of the 500 households at Year 0 (green dots) and again in Year 50 (brown dots) from poorest on the left to wealthiest on the right (see below) shows two sets of data points — one on top of the other — at the $205,000 wealth mark. The Year-50 data points (brown) are on top, so those are the only ones we can see. And since the data points stretch evenly across the graph, they look like a horizontal brown line. It’s no wonder they call this Flat Island.
Measures of Wealth Inequality
Since every household on Flat Island holds the same amount of wealth, these common measures of wealth inequality show no stratification at all:
| Value | |
|---|---|
| Range (wealth of richest household minus poorest household) | $0 |
| Gini Coefficient | 0.00 |
| Hoover Index (Robin Hood Index) | 0.00 |
| Coefficient of Variation | 0.00 |
| Quartile Coefficient of Dispersion (Q3–Q1)/(Q3+Q1) | 0.00 |
| Decile Coefficient of Dispersion (D9–D1)/(D9+D1) | 0.00 |
| 20:20 Ratio (ratio of wealth owned by the top 20% to the bottom 20%) | 1.0 |
| Palma Ratio (ratio of wealth owned by the top 10% to the bottom 40%) | 0.25 |
See an explanation of these Inequality Measures.
Wealth Quintiles
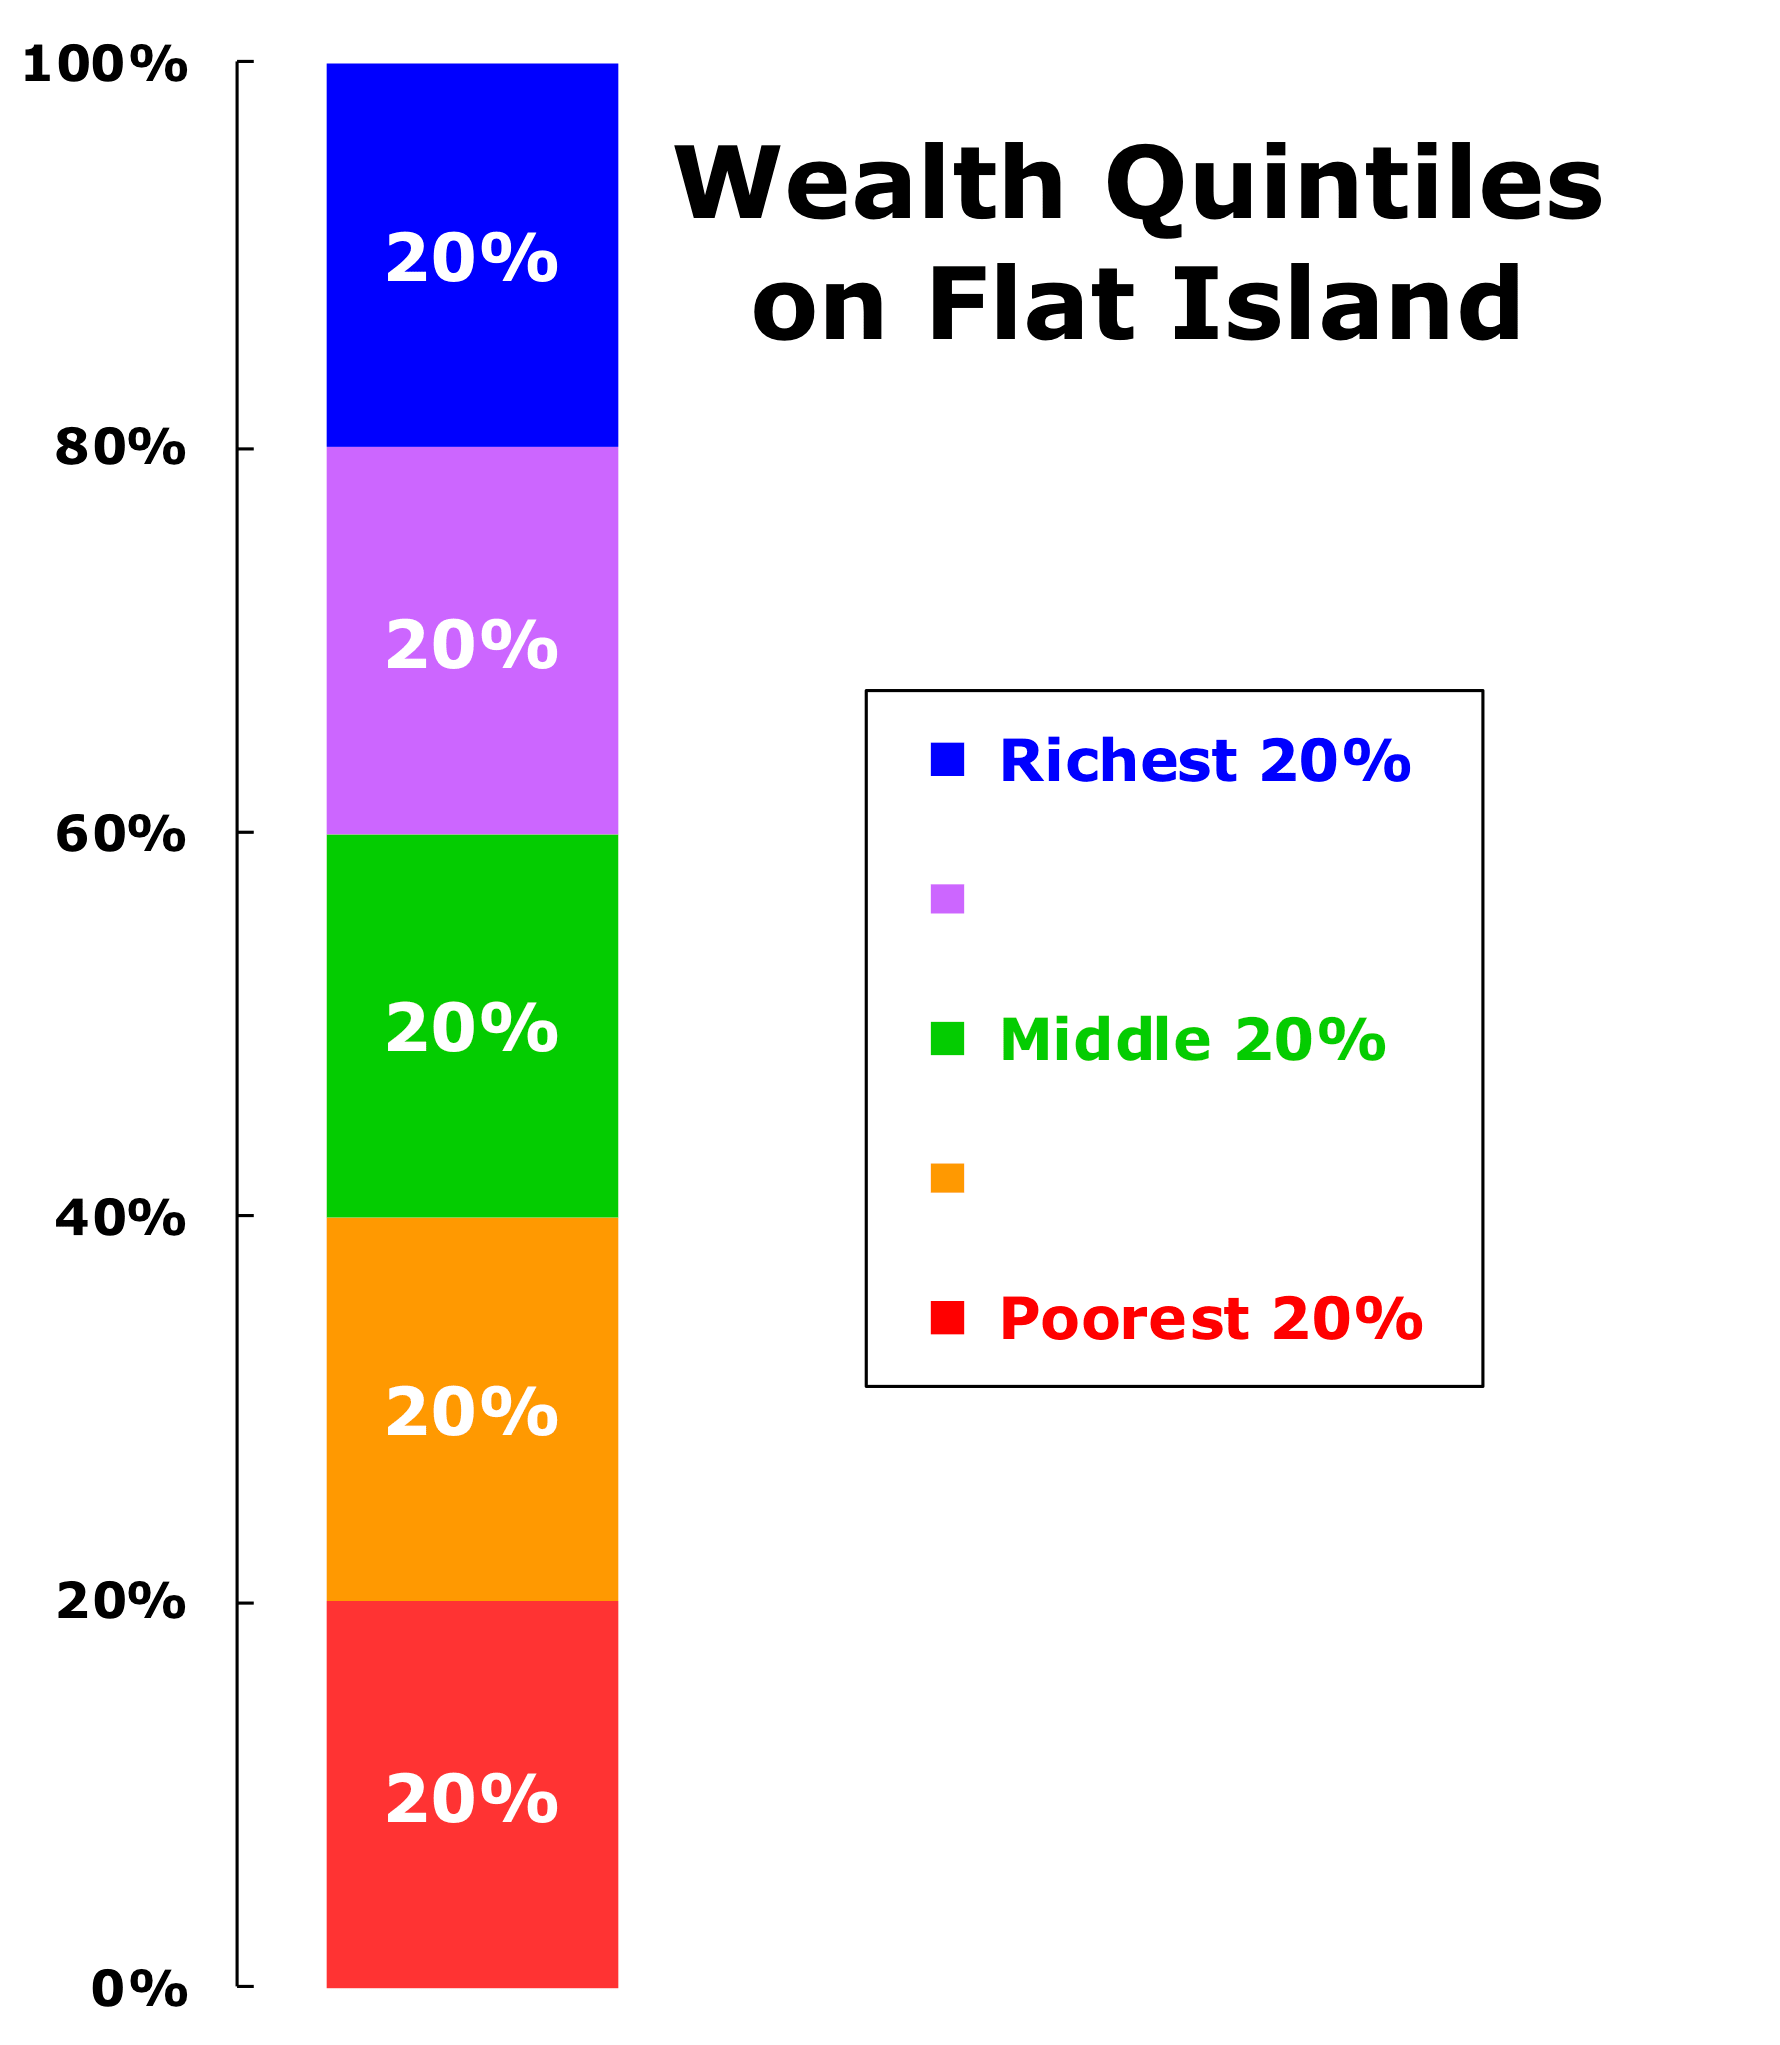 This graph shows the wealth held by each quintile (one-fifth) of the households (100 of the 500 total households) in Year 50. Since every household has the same amount of wealth, every quintile, from the richest 20% (the top quintile, shown in blue) to the poorest 20% (the bottom quintile, shown in red) have the exact same amount of wealth: 20% of the total.
Conclusion
These results are not at all unexpected given that everyone on Flat Island is essentially identical and Lady Luck also treats them exactly the same. These results are also eminently fair: everyone is equally capable and works equally hard, so it is befitting that they all end up with equal wealth.
Living in a place so uniform that every household continues to have the same middle-class wealth forever would probably be wonderful, but also quite peculiar — and perhaps boring.
Next Stop
The situation on our next stop, Rugged Island, is more familiar.

 Previous