 The Chancy Islands
  Menu
Menu
Beginning with a Very Unequal Society
Unlike on the other Chancy Islands, households on Skewed Island have very unequal levels of wealth in Year 0 — eerily similar to the distribution in the United States in 2016.[1] As on the other Chancy Islands, average household wealth is almost exactly $205,000, but the distribution is so skewed that household wealth initially ranges from –$47,000 to $13.3 million with 54 households having negative net worth, only 79 households having a net worth of more than $205,000, and 9 households with net worth of more than $2 million. Here are some basic measures showing the extreme inequality on Skewed Island in Year 0:[2]
| Value, Year 0 | |
|---|---|
| Range (wealth of richest household minus poorest household) | $13,391,000 |
| Gini Coefficient | 0.86 |
| Hoover Index (Robin Hood Index) | 0.69 |
| Coefficient of Variation | 4.32 |
| Quartile Coefficient of Dispersion (Q3–Q1)/(Q3+Q1) | 0.95 |
| Decile Coefficient of Dispersion (D9–D1)/(D9+D1) | 1.00 |
| 20:20 Ratio (ratio of wealth owned by the top 20% to the bottom 20%) | –211.13 |
| Palma Ratio (ratio of wealth owned by the top 10% to the bottom 40%) | 366.40 |
Wealth Quintiles in Year 0
 This graph of wealth held by each quintile of the households on Skewed Island in Year 0 clearly shows a very unequal society. The richest 20% (the top quintile, shown in blue) owns 88% of all wealth. This leaves just 12% for the other 80% of the households. The second quintile (the next wealthiest 20%, shown in purple) owns 9%, less than its share but still significantly more than the remaining quintiles. The middle quintile (in green) owns just 3%, far less than its share. The fourth quintile has just 1% of the total wealth, and the poorest 20% (in red) has no wealth (only debt). Unmistakably, the richest quintile has captured most of the wealth of this society.
Pursuing Parity
Seeing that the efforts to limit wealth inequality on Parity Island were so effective, the people on Skewed Island decided to implement the exact same measures to reduce inequality: a strong bankruptcy law that ensures that households never have less than $150,000 in equity in their homes (with the cost shared equally among all households), low annual interest rates of 3% above inflation, and a very strong annual wealth tax of 25% on all wealth above $225,000 with the proceeds distributed equally to all households.
These efforts are quite effective in reducing wealth inequality on Skewed Island so that by Year 50 the wealth distribution is comparable to that on Parity Island.
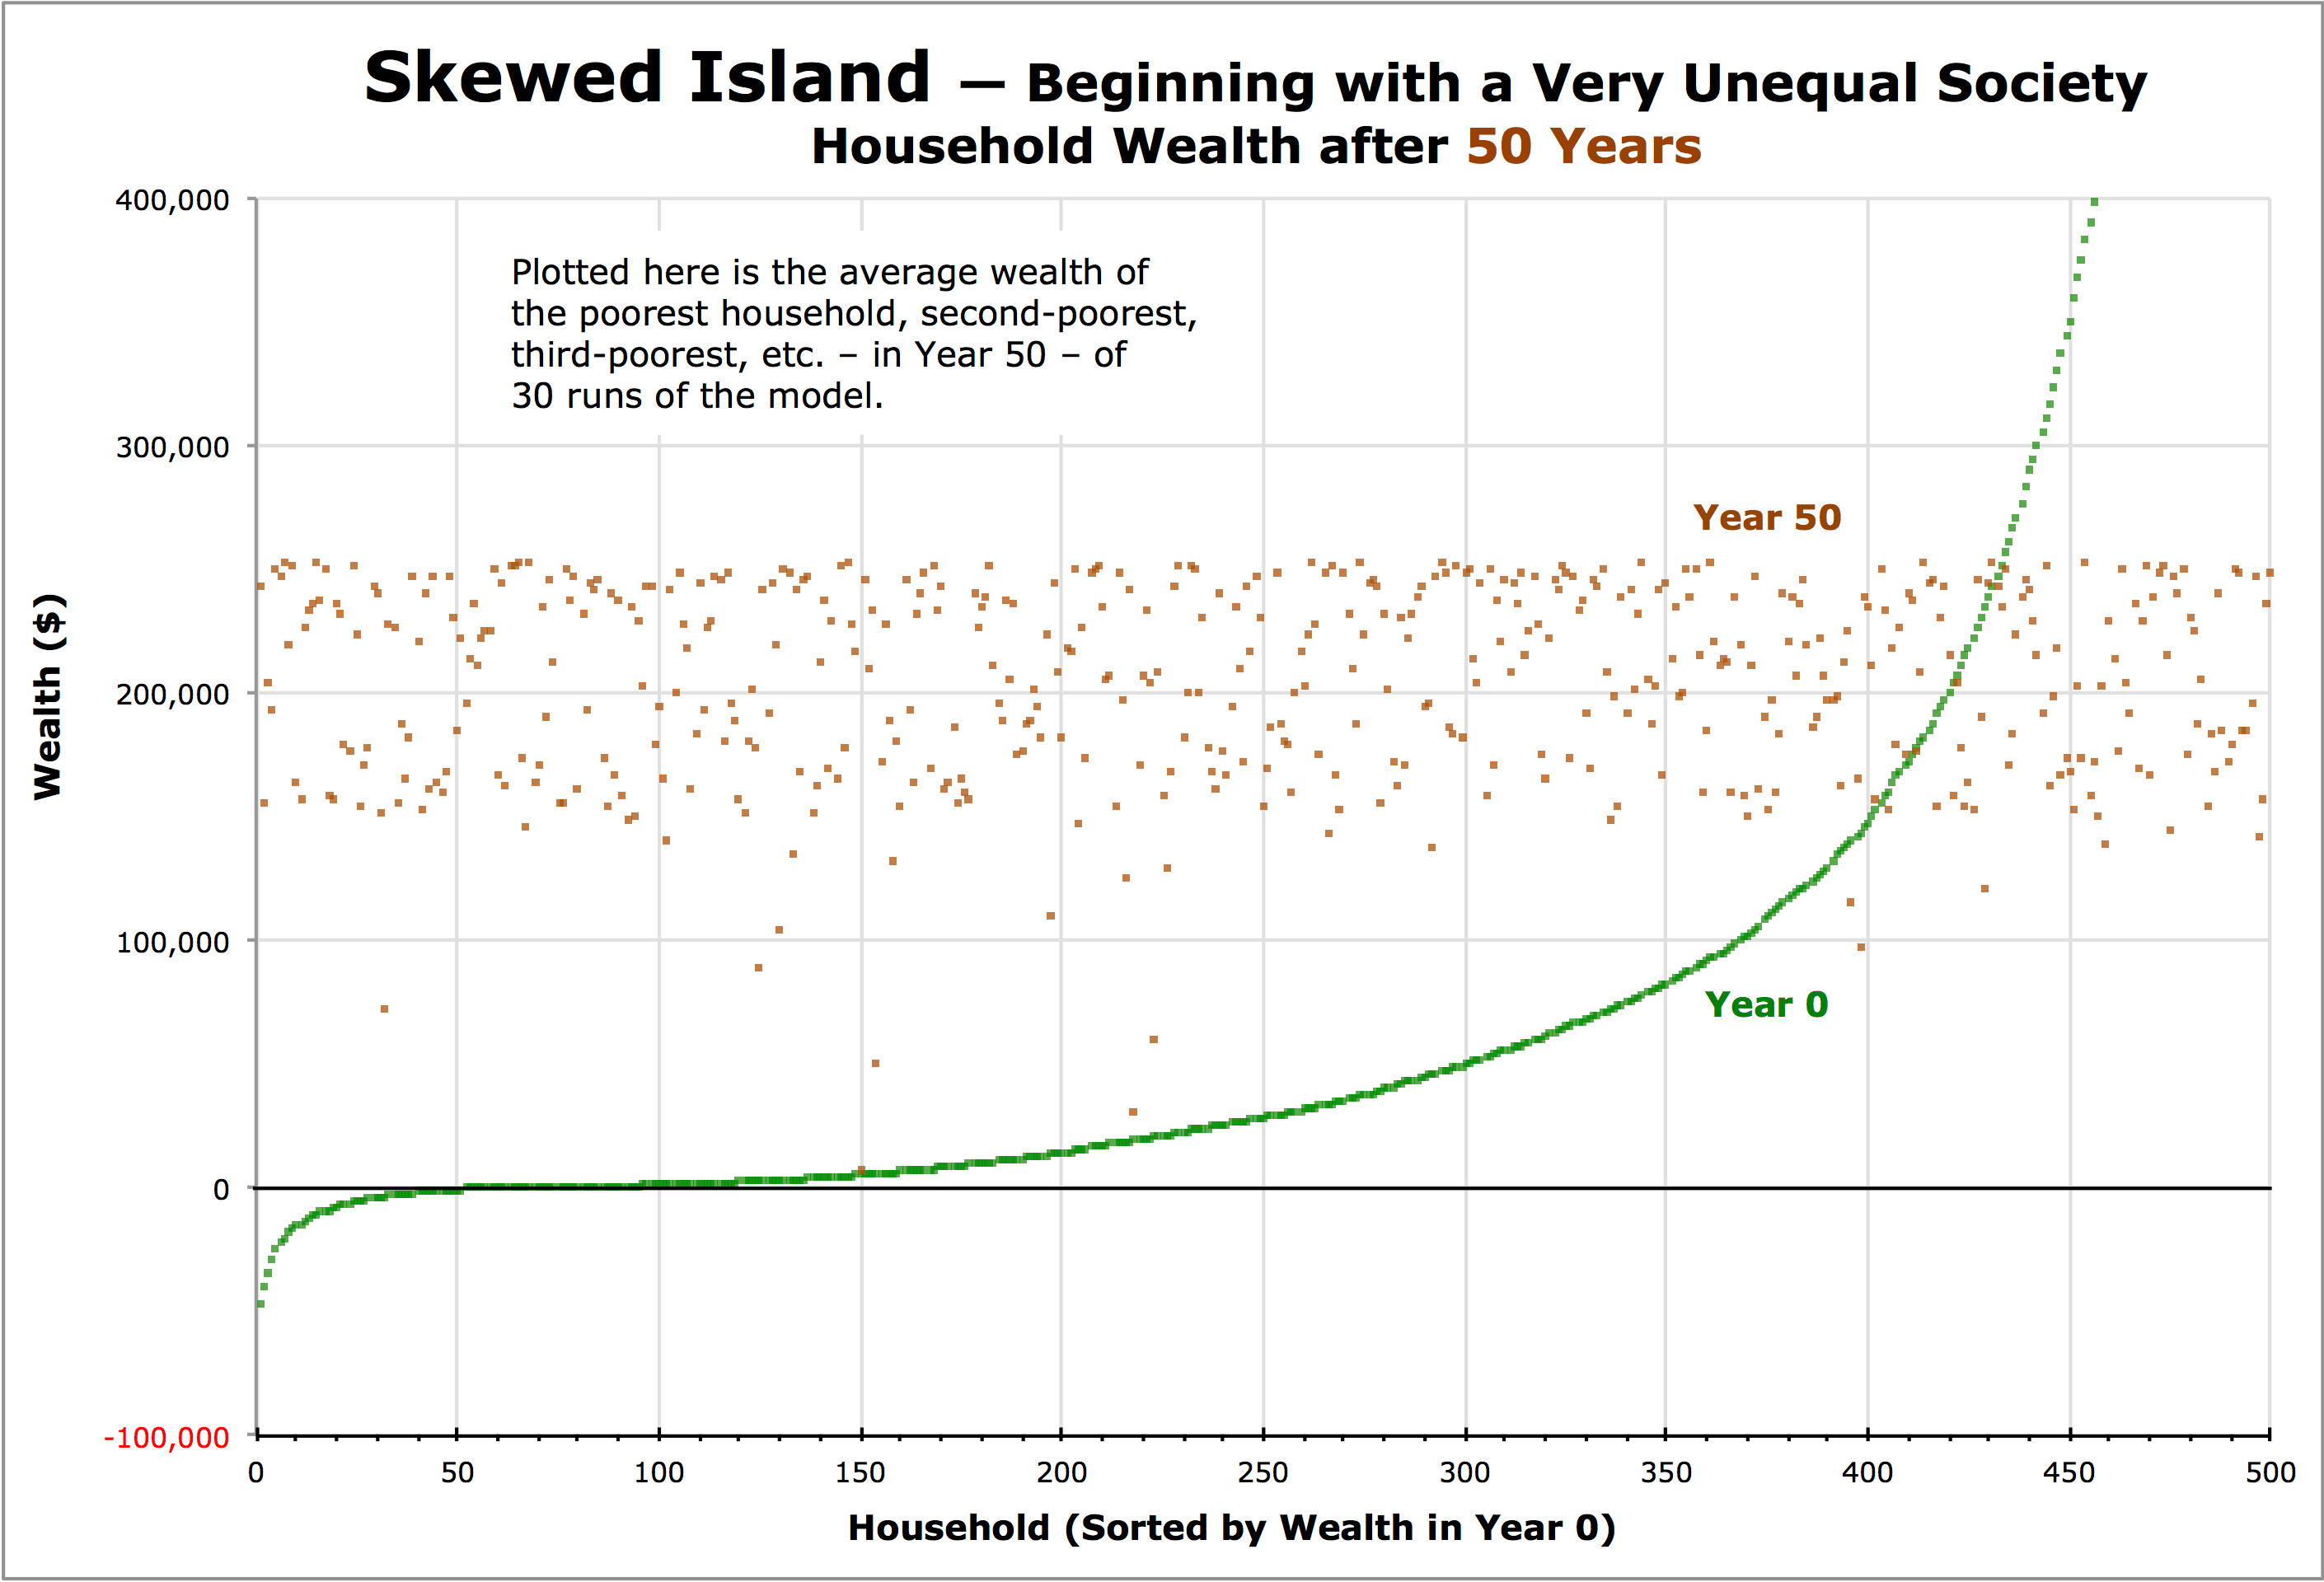
This graph sorts the households by their wealth in Year 0 (when inequality is greatest) so it is easier to see how the households develop by Year 50. If instead the households were sorted by Year 50 wealth, the Year 50 brown data points would look almost identical to those for Parity Island (and the Year 0 green data points would be scattered all over the graph).
Results
In the first year on Skewed Island, the 400 households with net worth less than $150,000 declare bankruptcy. But because there are so many bankruptcies, the bankruptcy fees they must all pay the next year push most of them back below the $150,000 bankruptcy threshold, so they declare bankruptcy again. This happens for a few few years, but bolstered by the tax bonus, most of these households move above the threshold by Year 4. Overall, there are more than 2,400 bankruptcies among these 500 households, most of them in the first few years.
Meanwhile, the wealth tax quickly reduces the net worth of the millionaire households, so by Year 12 the wealthiest household has wealth of less than $1 million. From then on, random luck becomes the largest determinant of wealth and by Year 50, the distribution looks essentially identical to Parity Island.
Poor Households
Some households begin with little net worth and others have a string of bad luck and lose net worth. But their wealth is bolstered by the bankruptcy law and wealth tax bonus so they are able to grow out of poverty. In the set of runs shown here, in Year 50, the poorest household has a net worth of $7,000 (which rebounds to $150,000 in the next year) and only about 25 households (5%) have net worth less than $150,000, essentially the same as on Parity Island.
Rich Households
Some households begin with great wealth and others are blessed by good luck throughout the 50-year study period and gain wealth. But the wealth tax reduces their excess wealth and keeps their net worth in check. In the set of runs shown here, the richest household ends up in Year 50 with $254,000 – exactly the same as on Parity Island.
Wealth Stratification
Wealth inequality on Skewed Island ends up being very much like Parity Island. By Year 50, the combined wealth of the richest 20% of households ($25 million) is not even twice the combined net worth of the poorest 20% of households ($15 million).
Measures of Wealth Inequality
These common measures of wealth inequality indicate a society with relatively little stratification. They are almost identical to those for Parity Island.
| Value | |
|---|---|
| Range (wealth of richest household minus poorest household) | $246,000 |
| Gini Coefficient | 0.11 |
| Hoover Index (Robin Hood Index) | 0.08 |
| Coefficient of Variation | 0.19 |
| Quartile Coefficient of Dispersion (Q3–Q1)/(Q3+Q1) | 0.16 |
| Decile Coefficient of Dispersion (D9–D1)/(D9+D1) | 0.23 |
| 20:20 Ratio (ratio of wealth owned by the top 20% to the bottom 20%) | 1.69 |
| Palma Ratio (ratio of wealth owned by the top 10% to the bottom 40%) | 0.38 |
Wealth Quintiles
 This graph of wealth held by each quintile of the households in Year 50, is vastly different than in Year 0 and looks identical to that for Parity Island. As on Parity Island, the richest 20% (the top quintile, shown in blue) owns just 24% of all wealth. The next wealthiest 20% (shown in purple) owns 23%. The middle quintile (in green) owns 21%. The poorest quintile (in red) has 14% of the total wealth, and the balance between all five quintiles is not far from even.
Into the Future
As on Parity Island, over the subsequent 50 years, different households on Skewed Island have increasing or decreasing wealth depending on the whims of luck. But the overall situation stays very stable, with the highest wealth remaining at about $254,000 and the lowest bounded by bankruptcy at $150,000. The Gini Coefficient remains stable as do the other indicators of inequality.
Conclusion
By implementing an extremely generous bankruptcy law and having a strong wealth tax, Skewed Island found a way to rapidly overcome its wealth inequality. Beginning with a distribution of wealth very similar to that of the United States in 2016, by Year 50 it developed a very flat distribution almost identical to Parity Island.
Next Stop
This is the end of our tour of the Chancy Islands. We hope you found it interesting and enlightening.
To learn more, see detailed Numerical Results for the seven Chancy Islands, read the overall Conclusion, consider several points of Criticism of our methodology along with our responses, download the Chancy Islands spreadsheet and try the model yourself, or explore Additional Resources.

 Previous
Notes
1. ^
To ascertain the actual wealth stratification in the United States, we rely on data originating from the Federal Reserve Bank’s 2016 Survey of Consumer Finances. The website DQYDJ used this data to create a net worth percentile calculator and wealth brackets which enabled us to construct a rough graph of net worth (including primary home equity) from percentile 0.5 (net worth = –$123,362) to 99.5 (net worth = $16,115,373). Then, we scaled this data (by dividing by 3.37216) and interpolated and extrapolated it to create a set of 500 households with net worth that mimic the wealth distribution of the United States in 2016 but, like the other Chancy Islands, have an average wealth of $205,000. For our calculations, see the spreadsheet called SkewedIslandInitial on GoogleDocs.
Note that because net worth in the United States rises exponentially at the high end and the extremely wealthy (net worth greater than $1 billion) represent only 0.0002% of the U.S. population, there is no way for the 500 households on Skewed Island to exactly replicate the wealth distribution at the extreme top. In Year 0, the net worth for the richest household on Skewed Island (0.2% of the population) is set at $13.3 million (equivalent to $45 million in the U.S.), but this is far less than the net worth of the richest Americans. In June 2019, Forbes magazine estimates that the richest person, Jeff Bezos (founder of Amazon.com), had a net worth of $158 billion and that 607 Americans had net worth of $1 billion or more.
2. ^
A complete list of numerical results for Skewed Island in Year 0 is shown (with a green background) on the Numerical Results page along with those for the seven other islands in Year 50.