 The Chancy Islands
  Menu
Menu
Details of the Chancy Island Model
Extra Expenses
Calculating Random Extra Expenses
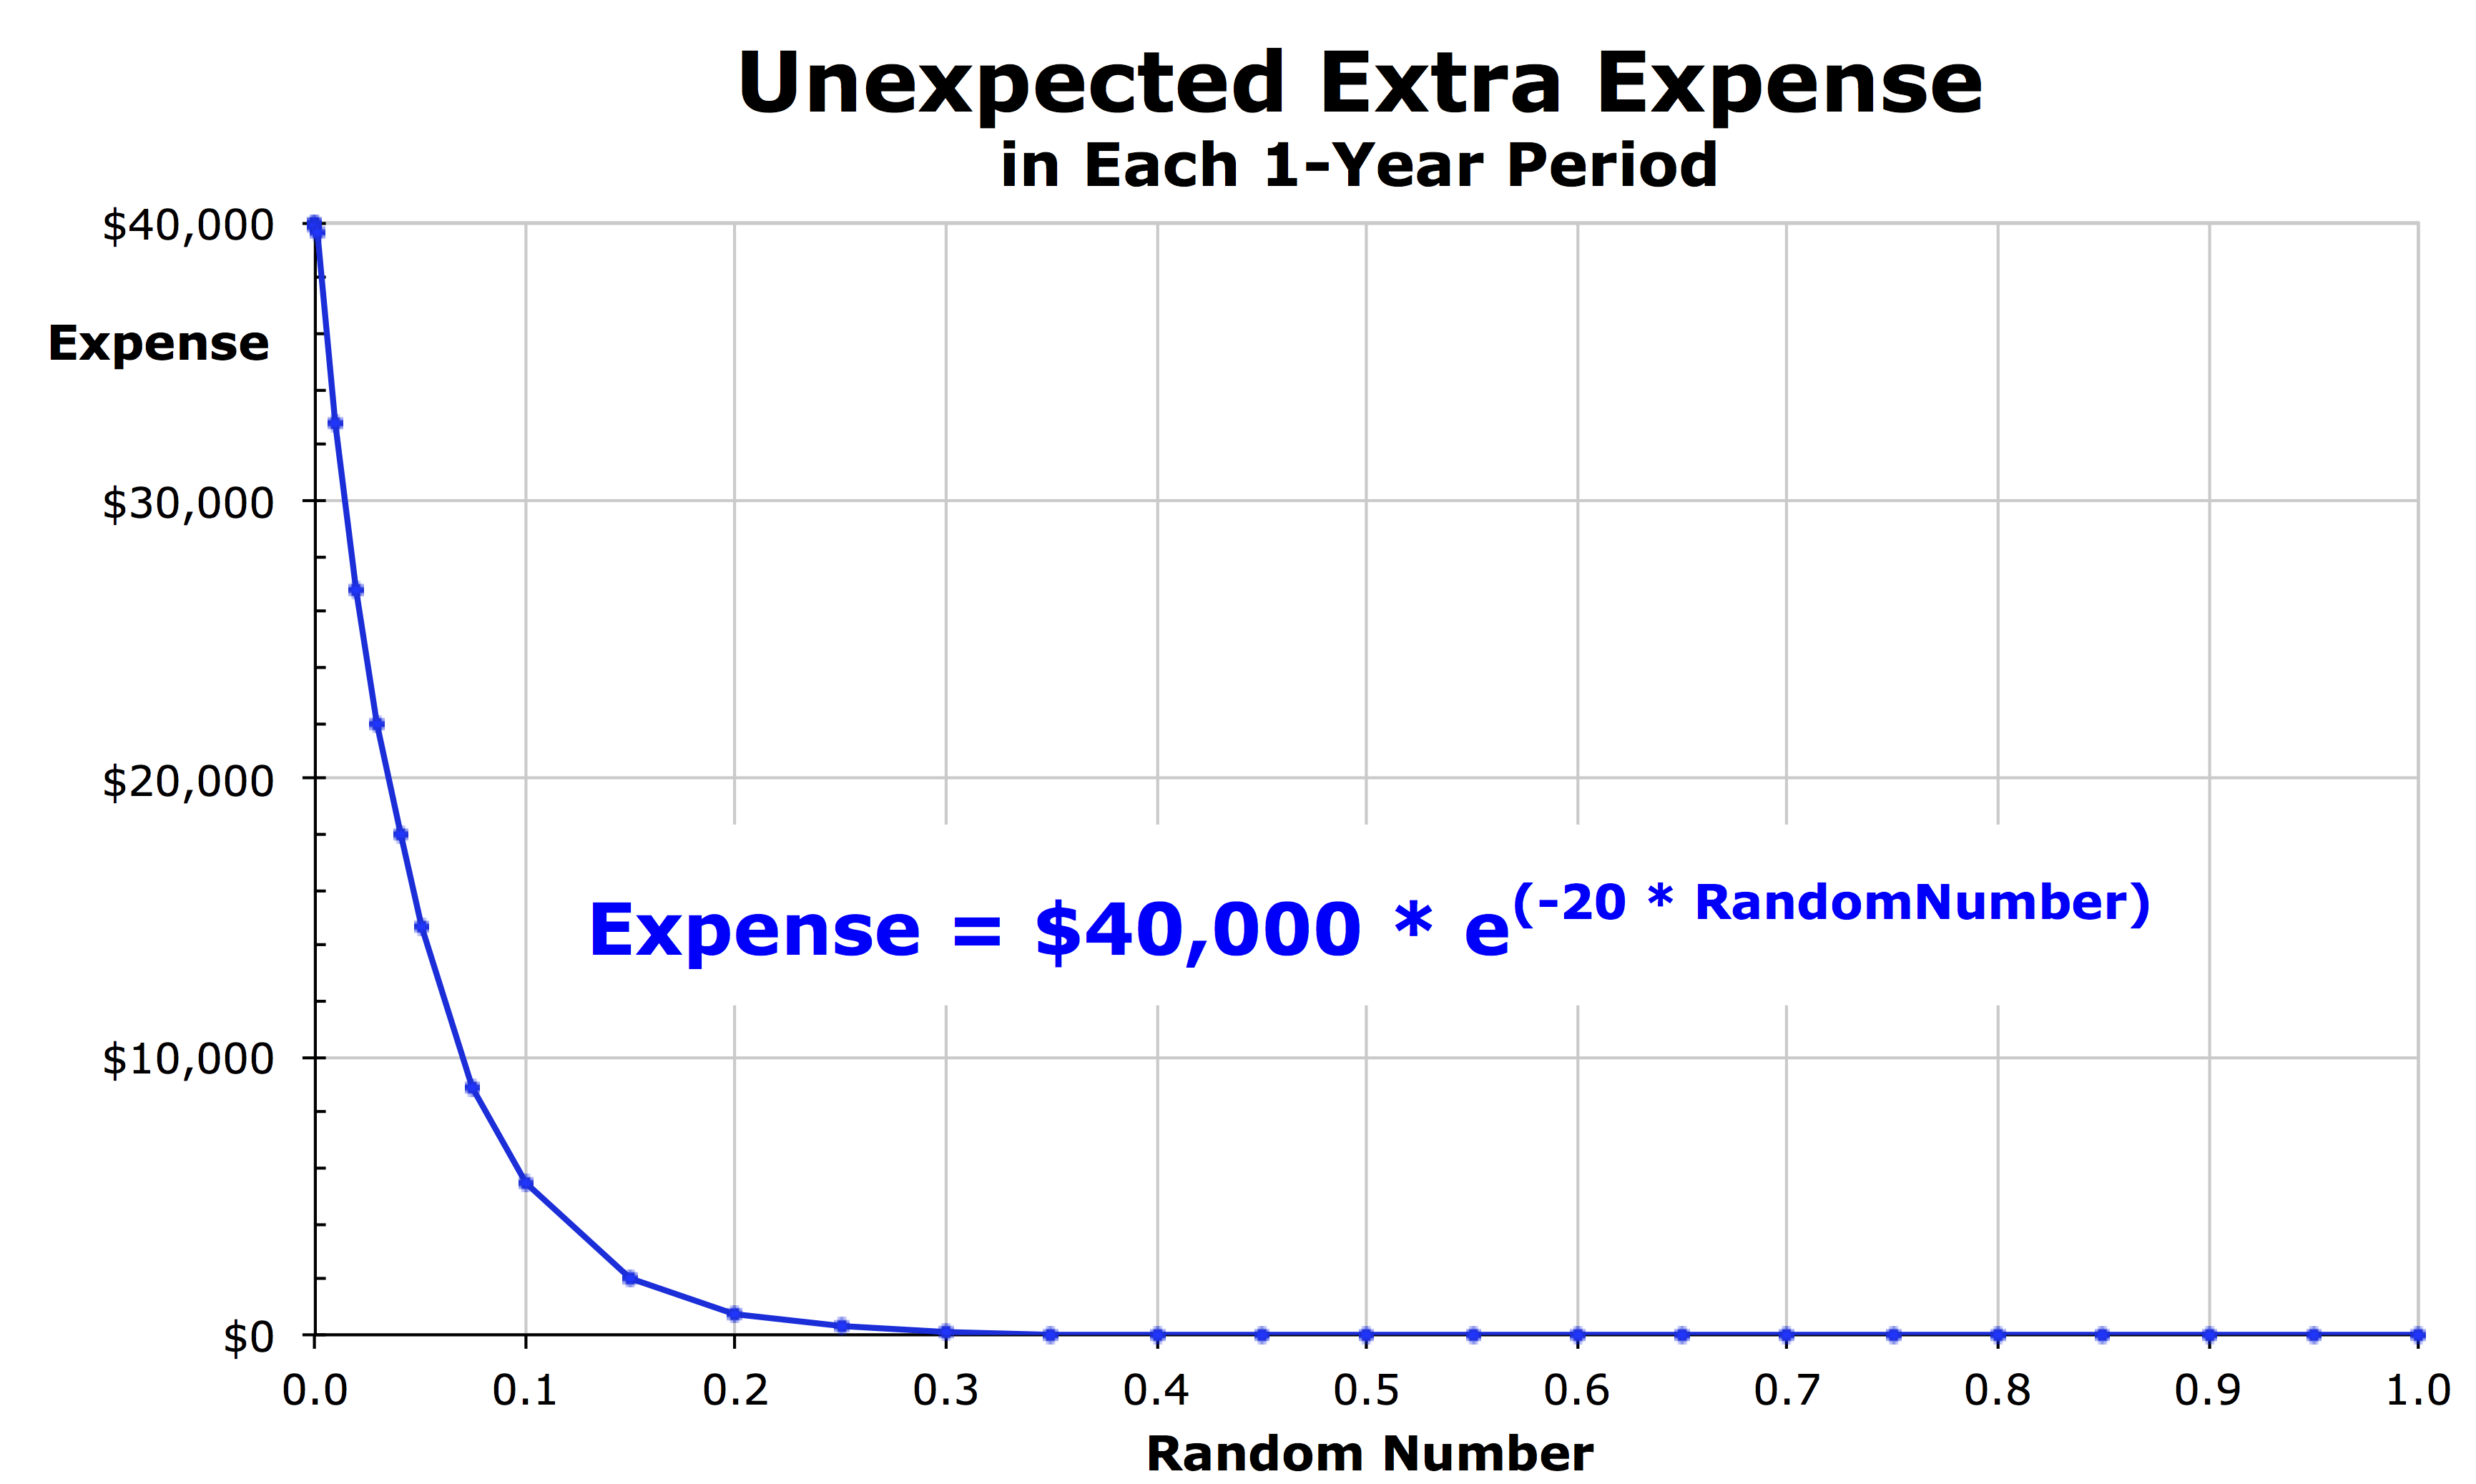 In the model, the amount of these unexpected extra expenses is randomly calculated for each household for each year by feeding a computer-generated random number into an exponential decay function that rapidly decays (see figure). Even though the maximum expense any household can possibly incur in any year is $40,000 (when the random number is zero), the actual expense incurred is very low (or zero) for most households in most years.
Specifically, in each year, for 45% of the households, the calculated expense is no more than $0.67. Since any amount less than a dollar is truncated to $0, 45% of the households incur absolutely nothing. Each year, another 35% of households have extra expenses ranging from $1 to $730 and averaging just $105, and another 10% of households have unexpected expenses ranging from $730 to $5,400 and averaging $2,340. For the unluckiest 10% of households in each year, the expenses range between $5,413 and $40,000 and the average for these unlucky households is $17,293. In 50 years, every household is likely to have one year in which their unexpected extra expense is greater than $27,000. But some households have a large expense in multiple years while others never do throughout the 50-year study period.
 Back to the Welcome page
Catastrophic Losses
Calculating Random Catastrophic Losses
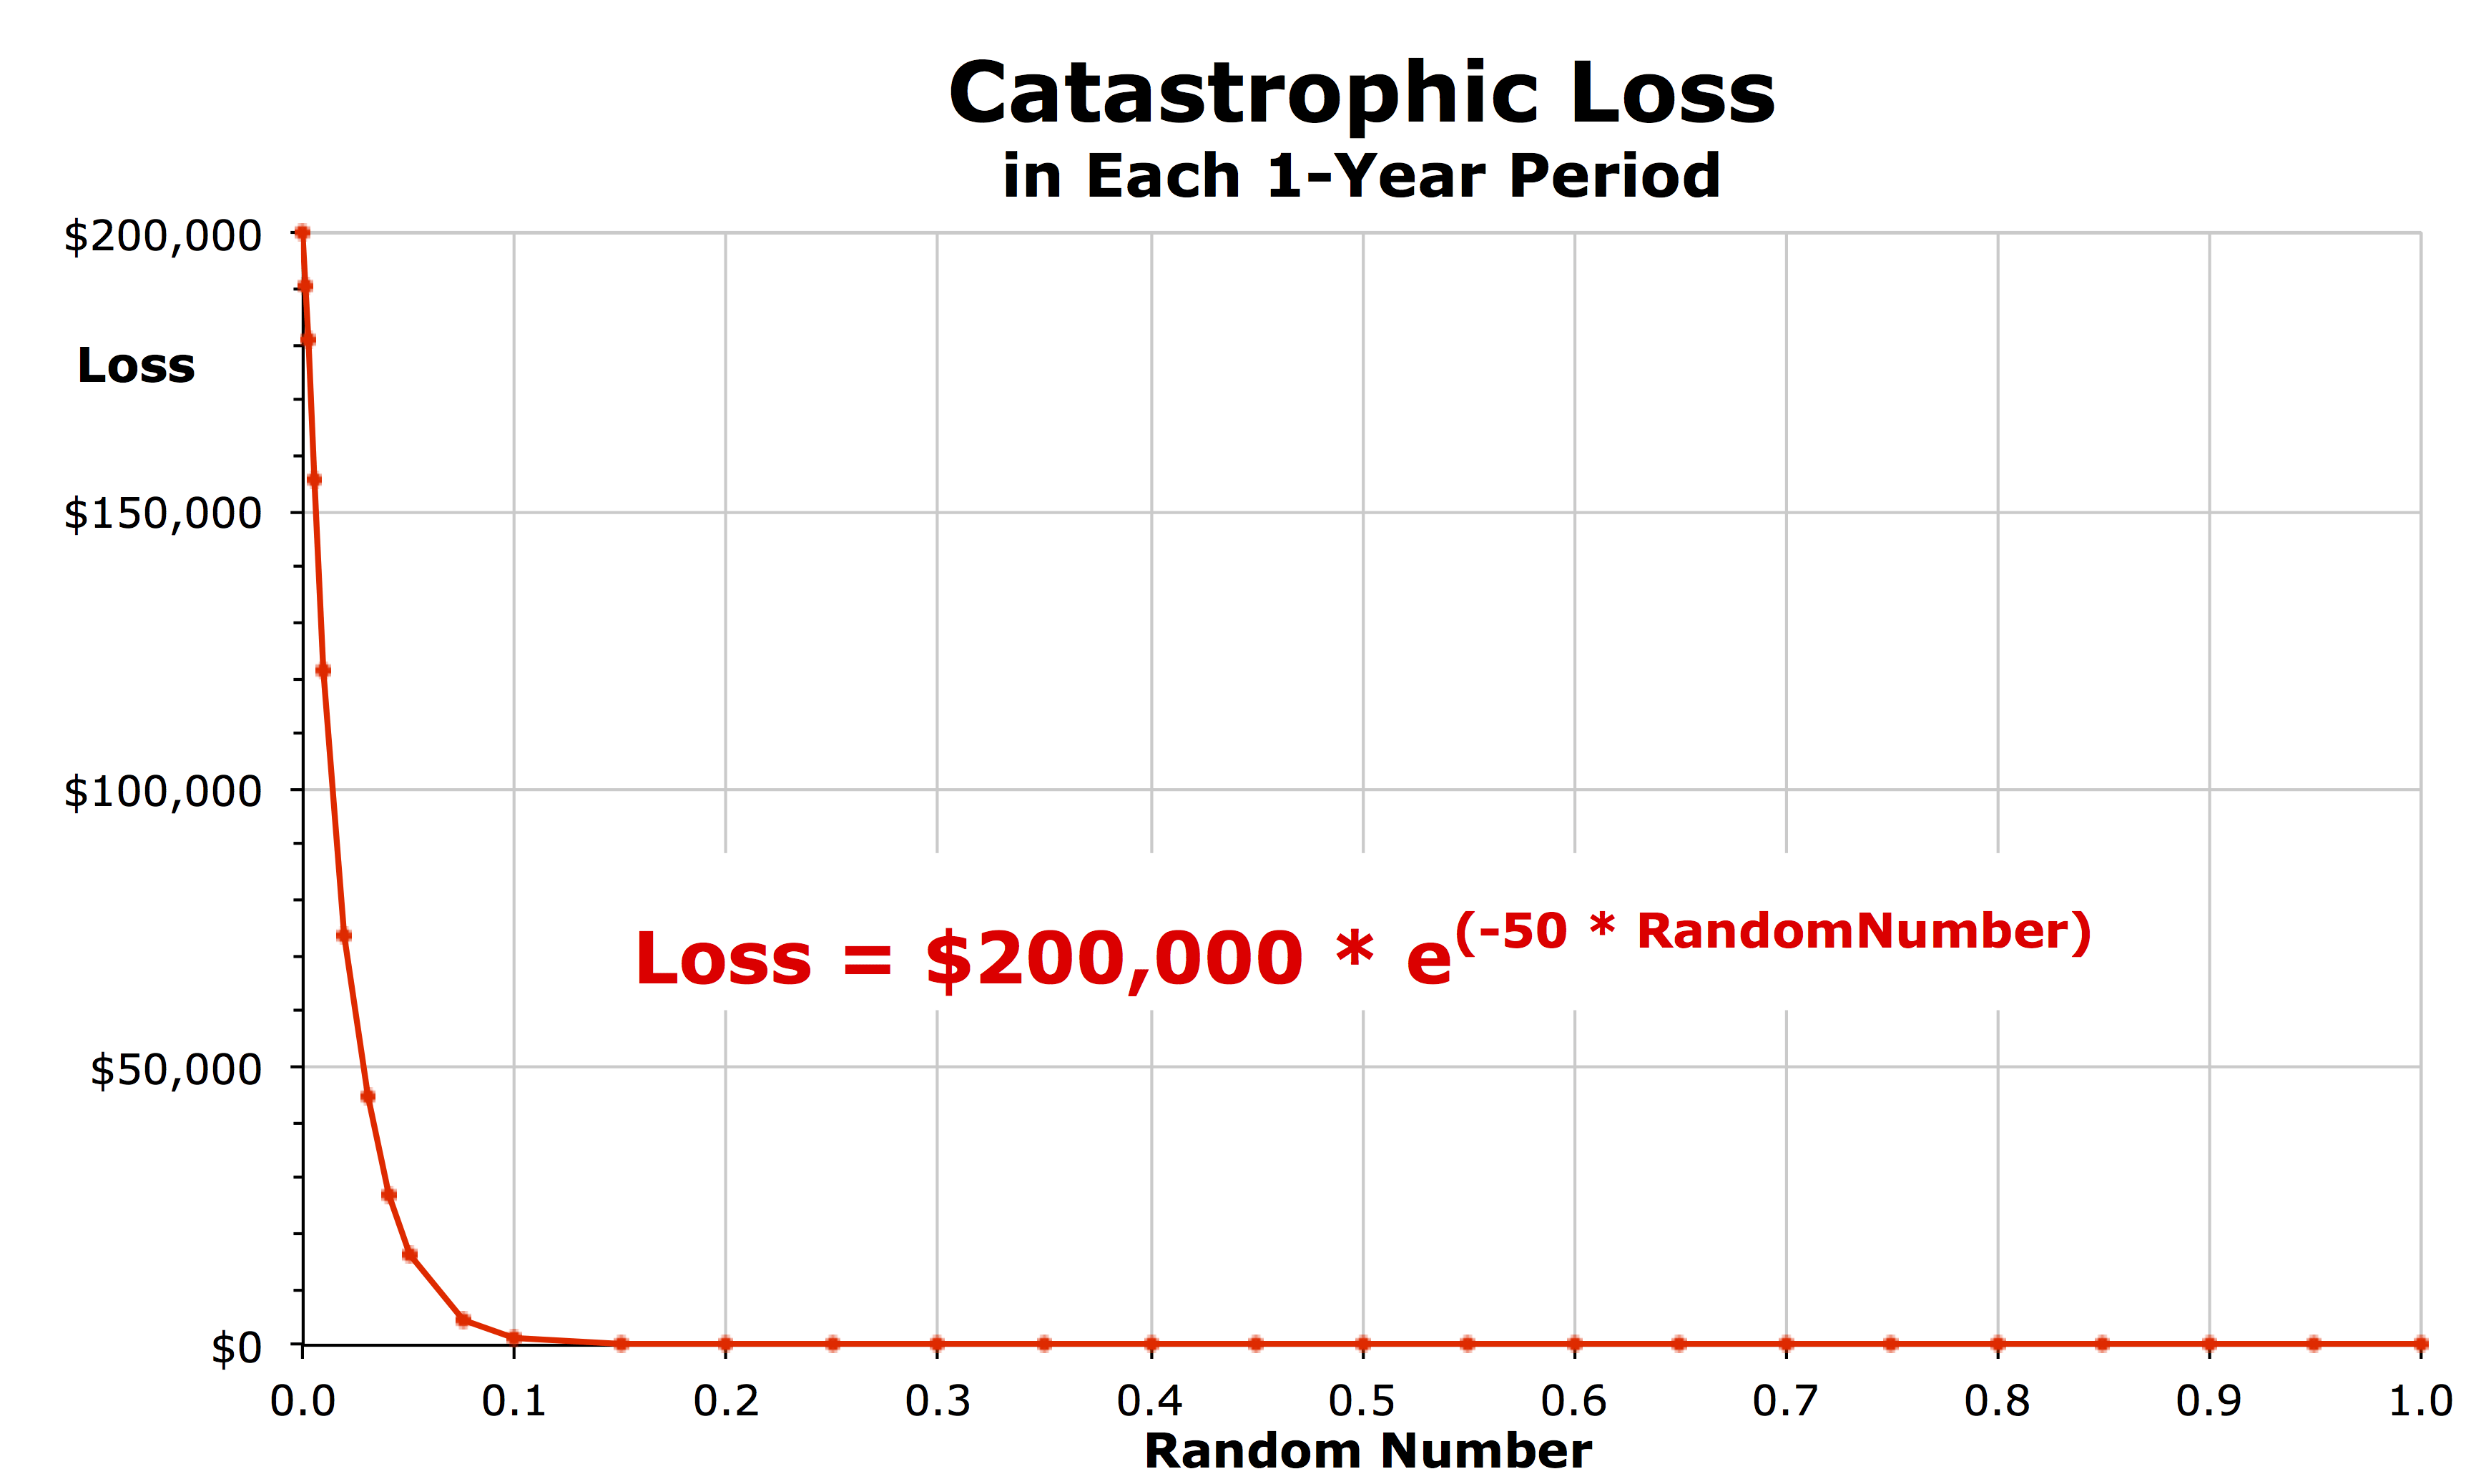 The cost of the loss in each year is again calculated by using an exponential decay function, but with a much higher peak ($200,000) and with an extremely rapid decay rate. In each year, 75% of households incur a loss of less than $0.75 (truncated to $0). In another 15% of the households, the loss ranges from $1 to $1,350 and averages just $180. But each year, the last 10% of households incur a large loss, ranging from $1,350 to $200,000 and averaging $39,700. Over 50 years, each household is likely to have one catastrophic loss greater than $73,000. But some households have large catastrophic losses in multiple years while others never do throughout the entire 50-year study period.
Loan Interest
Calculating Interest Paid and Received
The model adds up the total amount held by all of the households with cash wealth (above the $200,000 value of their home for the previous year) and also adds up the total amount below the $200,000 amount for every household without cash wealth. To calculate the interest payment amounts due in the current year, for each household with a loan need, the model subtracts an interest payment equal to the interest rate times the amount of the household’s wealth in the previous year that was below $200,000.
To calculate the loan interest amount earned in the current year for each household with cash wealth, the model determines the household’s cash wealth in the previous year, multiples by the annual interest rate, and adjusts for that household’s proportion of the total by dividing by the total amount of all of the cash wealth held by all of the households in the previous year. These calculations ensure that the total of all loan payments to all households exactly equals the total interest paid each year to all households.
Note that this procedure is odd in that all of the calculations take place at the very end of the year, so some households are recorded as having an especially low wealth at the end of the year until they receive a loan at the beginning of the next year. In reality, of course, expenses are not actually incurred through the very last minute of the year and loans are not extended immediately at the beginning of the next year. But this is how the spreadsheet model works.
