 The Chancy Islands
  Menu
Menu
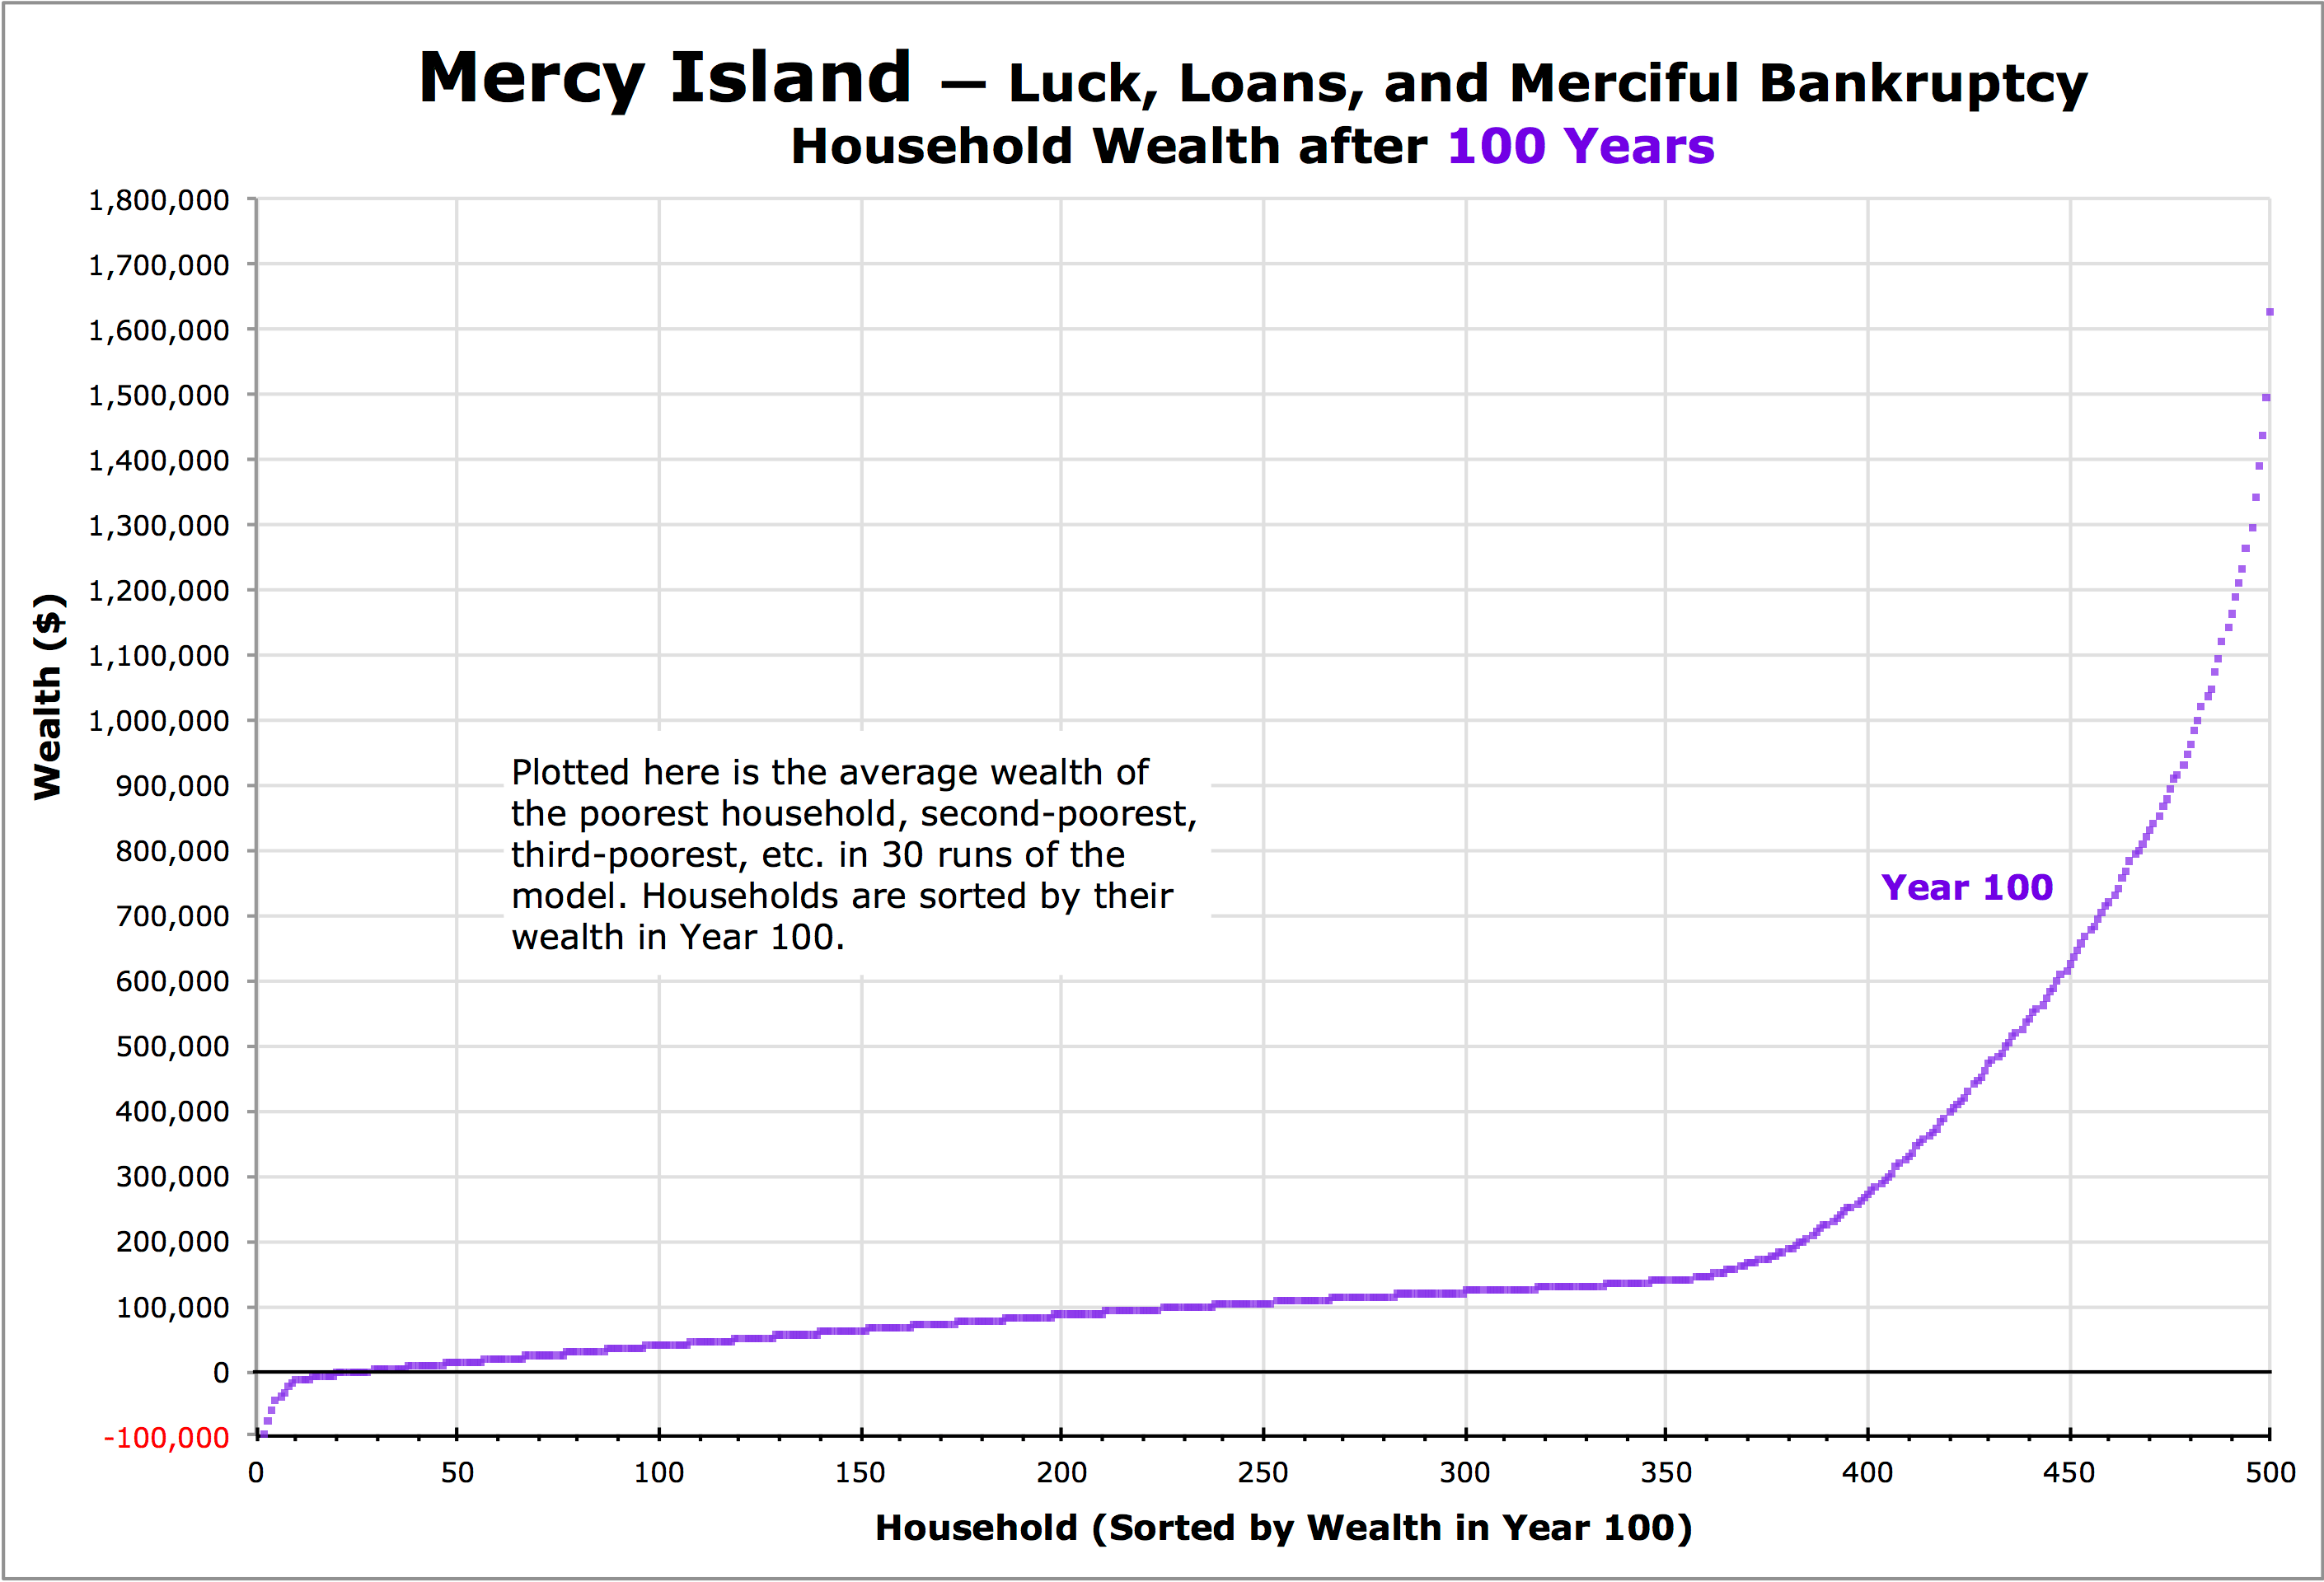
Resemblance: Mercy Island in Year 100
and the United States in 2016
A Resemblance
After 100 years of unequal allotments of bad luck, the wealth distribution on Mercy Island is somewhat similar to the highly unequal distribution on Skewed Island in Year 0 (which reflects the distribution in the United States in 2016)[1] — and continually grows more similar.
This uncanny resemblance suggests that luck may be a fairly important factor in determining wealth in the United States — and in general.

| Mercy Island, Year 100 |
Skewed Island, Year 0 |
|
|---|---|---|
| Range (wealth of richest household minus poorest household) | $1,757,000 | $13,391,000 |
| Gini Coefficient | 0.62 | 0.85 |
| Hoover Index (Robin Hood Index) | 0.48 | 0.69 |
| Coefficient of Variation | 1.40 | 4.32 |
| Quartile Coefficient of Dispersion (Q3–Q1)/(Q3+Q1) | 0.55 | 0.95 |
| Decile Coefficient of Dispersion (D9–D1)/(D9+D1) | 1.00 | 1.01 |
| 20:20 Ratio (ratio of wealth owned by the top 20% to the bottom 20%) | 86.99 | -211.13 |
| Palma Ratio (ratio of wealth owned by the top 10% to the bottom 40%) | 6.74 | 366.40 |
 Back to the Conclusion Page
Notes
1. ^
The richest households in the United States are far wealthier than the top households on Mercy Island, even after that island has stratified for 100 years. Also, the U.S. social safety net ensures that the poorest households are better off in the United States than on Mercy Island. Still, the overall shape of the distribution is similar. With more time to stratify, Mercy Island might eventually match the highly skewed distribution in the U.S.